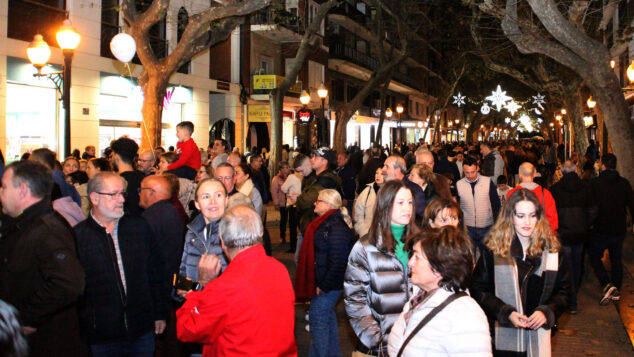
Population census: how much has Dénia grown and where are its inhabitants from?
Below you have an index with all the points that we are going to deal with in this article.
Table of Contents
- 1.
- 1.1.
- 1.2.
- 2.
- 2.1.
- 2.2.
- 3.
Number of inhabitants of Dénia in 2023
The capital of the Marina Alta has today 49.047 inhabitants, according to data from the Dénia City Council, of which 23.844 are men and 25.203 are women. It means that growth is maintained compared to 2022, when the total population was 46.149 inhabitants, according to the same source.

According to the National Institute of Statistics, however, the figure is much lower. The INE indicated that the Dianense population would reach 2023 inhabitants in 45.893, also marking the great growth compared to its previous data, of 43.899 people in 2022.
demographic evolution
From the mid-nineties until today, Dénia has suffered a great demographic growth parallel to the real estate and tourism boom. In fact, it has added more than 15.000 inhabitants in recent decades, placing it as the eighteenth most inhabited town in the Valencian Community in 2022.
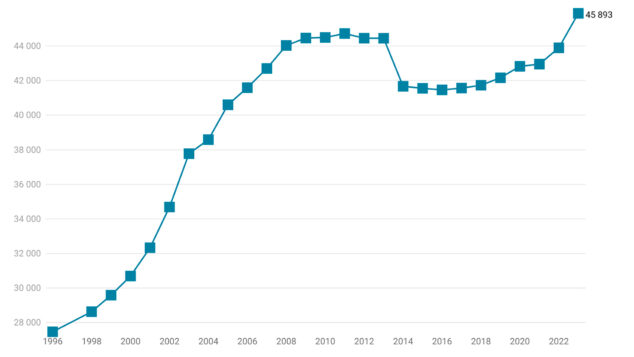
| Year | Residents |
|---|---|
| 2023 | 45893 |
| 2022 | 43899 |
| 2021 | 42953 |
| 2020 | 42827 |
| 2019 | 42166 |
| 2018 | 41733 |
| 2017 | 41568 |
| 2016 | 41465 |
| 2015 | 41553 |
| 2014 | 41672 |
| 2013 | 44450 |
| 2012 | 44455 |
| 2011 | 44726 |
| 2010 | 44498 |
| 2009 | 44464 |
| 2008 | 44035 |
| 2007 | 42704 |
| 2006 | 41591 |
| 2005 | 40601 |
| 2004 | 38584 |
| 2003 | 37773 |
| 2002 | 34686 |
| 2001 | 32332 |
| 2000 | 30693 |
| 1999 | 29585 |
| 1998 | 28629 |
| 1996 | 27469 |
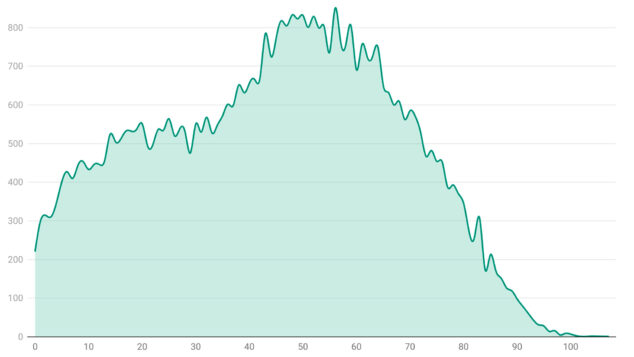
Population pyramid: by age and sex
In Dénia there are more women than men. The female population reaches the figure of 25.203, while the male population is 23.844. In terms of age, most of the residents are between 40 and 60 years old.
| Age | Men | Women | Total |
|---|---|---|---|
| 0 | 120 | 102 | 222 |
| 1 | 146 | 154 | 300 |
| 2 | 164 | 150 | 314 |
| 3 | 152 | 159 | 311 |
| 4 | 176 | 172 | 348 |
| 5 | 214 | 188 | 402 |
| 6 | 203 | 224 | 427 |
| 7 | 201 | 209 | 410 |
| 8 | 238 | 206 | 444 |
| 9 | 239 | 214 | 453 |
| 10 | 223 | 210 | 433 |
| 11 | 238 | 208 | 446 |
| 12 | 229 | 217 | 446 |
| 13 | 206 | 251 | 457 |
| 14 | 273 | 251 | 524 |
| 15 | 274 | 231 | 505 |
| 16 | 267 | 245 | 512 |
| 17 | 273 | 260 | 533 |
| 18 | 276 | 256 | 532 |
| 19 | 259 | 279 | 538 |
| 20 | 274 | 277 | 551 |
| 21 | 260 | 234 | 494 |
| 22 | 264 | 234 | 498 |
| 23 | 279 | 258 | 537 |
| 24 | 263 | 272 | 535 |
| 25 | 288 | 276 | 564 |
| 26 | 280 | 241 | 521 |
| 27 | 284 | 254 | 538 |
| 28 | 267 | 263 | 530 |
| 29 | 258 | 218 | 476 |
| 30 | 281 | 270 | 551 |
| 31 | 288 | 242 | 530 |
| 32 | 298 | 270 | 568 |
| 33 | 252 | 276 | 528 |
| 34 | 248 | 299 | 547 |
| 35 | 277 | 295 | 572 |
| 36 | 284 | 318 | 602 |
| 37 | 278 | 321 | 599 |
| 38 | 325 | 326 | 651 |
| 39 | 301 | 331 | 632 |
| 40 | 318 | 338 | 656 |
| 41 | 326 | 340 | 666 |
| 42 | 306 | 365 | 671 |
| 43 | 405 | 380 | 785 |
| 44 | 334 | 393 | 727 |
| 45 | 383 | 389 | 772 |
| 46 | 388 | 430 | 818 |
| 47 | 358 | 447 | 805 |
| 48 | 400 | 433 | 833 |
| 49 | 407 | 416 | 823 |
| 50 | 398 | 434 | 832 |
| 51 | 419 | 382 | 801 |
| 52 | 386 | 443 | 829 |
| 53 | 400 | 399 | 799 |
| 54 | 401 | 400 | 801 |
| 55 | 347 | 390 | 737 |
| 56 | 412 | 438 | 850 |
| 57 | 342 | 426 | 768 |
| 58 | 359 | 396 | 755 |
| 59 | 369 | 435 | 804 |
| 60 | 335 | 356 | 691 |
| 61 | 357 | 398 | 755 |
| 62 | 372 | 353 | 725 |
| 63 | 352 | 373 | 725 |
| 64 | 334 | 416 | 750 |
| 65 | 304 | 347 | 651 |
| 66 | 300 | 332 | 632 |
| 67 | 292 | 308 | 600 |
| 68 | 312 | 297 | 609 |
| 69 | 260 | 303 | 563 |
| 70 | 288 | 297 | 585 |
| 71 | 271 | 299 | 570 |
| 72 | 254 | 274 | 528 |
| 73 | 233 | 234 | 467 |
| 74 | 228 | 254 | 482 |
| 75 | 211 | 243 | 454 |
| 76 | 218 | 235 | 453 |
| 77 | 171 | 217 | 388 |
| 78 | 174 | 219 | 393 |
| 79 | 178 | 193 | 371 |
| 80 | 162 | 184 | 346 |
| 81 | 114 | 160 | 274 |
| 82 | 110 | 146 | 256 |
| 83 | 126 | 181 | 307 |
| 84 | 72 | 103 | 175 |
| 85 | 90 | 122 | 212 |
| 86 | 66 | 106 | 172 |
| 87 | 55 | 97 | 152 |
| 88 | 50 | 77 | 127 |
| 89 | 51 | 68 | 119 |
| 90 | 36 | 62 | 98 |
| 91 | 27 | 53 | 80 |
| 92 | 20 | 42 | 62 |
| 93 | 11 | 33 | 44 |
| 94 | 7 | 24 | 31 |
| 95 | 8 | 20 | 28 |
| 96 | 3 | 11 | 14 |
| 97 | 5 | 11 | 16 |
| 98 | 1 | 4 | 5 |
| 99 | 2 | 7 | 9 |
| 100 | 2 | 5 | 7 |
| 101 | 1 | 2 | 3 |
| 102 | 0 | 1 | 1 |
| 103 | 1 | 0 | 1 |
| 104 | 1 | 1 | 2 |
| 107 | 1 | 0 | 1 |
Inhabitants by nationality: what countries do foreigners living in Dénia come from?
Dénia, in addition to receiving thousands of visitors every summer, also welcomes indefinitely a large number of people who come from abroad and who decide to reside in the capital of the Marina Alta. In fact, just 33.769 inhabitants of Dénia, 68,85% of the total, are Spanish.
Therefore, the foreign population living in Dénia is 15.278, more than a quarter of the total.
Main nationalities of residents in Dénia
Not counting the Spanish, two of the predominant nationalities in Dénia They are German and British. Nevertheless, The foreign country where the largest number of Dénia residents come from is Colombia.
Now, How many German, Colombian and English inhabitants are there in Dénia? From Germany 1400 residents arrived in Dénia and from Colombia 2090. From England it is unknown, but from the United Kingdom there are 1432. The Ukrainians follow closely behind, with 1155 residents.
How many nationalities coexist in Dénia?
The population of Dénia comes from 107 different countries, with representation from the 5 continents.
| Country | Residents | Total % |
|---|---|---|
| Albania | 4 | 0,008% |
| Germany | 1400 | 2,854% |
| Angola | 1 | 0,002% |
| Stateless | 2 | 0,004% |
| Saudi Arabia | 4 | 0,008% |
| Algeria | 76 | 0,155% |
| Argentina | 408 | 0,832% |
| Armenia | 56 | 0,114% |
| Australia | 8 | 0,016% |
| Austria | 55 | 0,112% |
| Azerbaijan | 3 | 0,006% |
| Bangladesh | 2 | 0,004% |
| Belgium | 175 | 0,357% |
| Belarus | 19 | 0,039% |
| Bolivia | 47 | 0,096% |
| Brazil | 116 | 0,237% |
| Bulgaria | 491 | 1,001% |
| Cape Verde | 1 | 0,002% |
| Cameroon | 2 | 0,004% |
| Canada | 48 | 0,098% |
| Chile | 54 | 0,11% |
| China | 177 | 0,361% |
| Cyprus | 2 | 0,004% |
| Colombia | 2090 | 4,261% |
| Comoros | 1 | 0,002% |
| Costa Rica | 3 | 0,006% |
| Croatia | 3 | 0,006% |
| Cuba | 216 | 0,44% |
| Denmark | 17 | 0,035% |
| Ecuador | 232 | 0,473% |
| Egypt | 2 | 0,004% |
| El Salvador | 9 | 0,018% |
| Slovakia | 24 | 0,049% |
| Slovenia | 2 | 0,004% |
| Spain | 33769 | 68,85% |
| United States of America | 148 | 0,302% |
| Estonia | 27 | 0,055% |
| Ethiopia | 2 | 0,004% |
| Philippines | 14 | 0,029% |
| Finland | 8 | 0,016% |
| France | 678 | 1,382% |
| Gambia | 2 | 0,004% |
| Georgia | 4 | 0,008% |
| Ghana | 1 | 0,002% |
| Grenada | 1 | 0,002% |
| Greece | 5 | 0,01% |
| Guatemala | 1 | 0,002% |
| Equatorial Guinea | 3 | 0,006% |
| Haiti | 1 | 0,002% |
| Honduras | 62 | 0,126% |
| Hungary | 37 | 0,075% |
| India | 107 | 0,218% |
| Indonesia | 6 | 0,012% |
| Iraq | 2 | 0,004% |
| Iran | 4 | 0,008% |
| Ireland | 103 | 0,21% |
| Iceland | 22 | 0,045% |
| Israel | 21 | 0,043% |
| Italy | 640 | 1,305% |
| Japan | 2 | 0,004% |
| Jordan | 1 | 0,002% |
| Kazakhstan | 78 | 0,159% |
| Kenya | 3 | 0,006% |
| Latvia | 20 | 0,041% |
| Lithuania | 70 | 0,143% |
| Luxembourg | 9 | 0,018% |
| Mali | 1 | 0,002% |
| Malta | 2 | 0,004% |
| Morocco | 496 | 1,011% |
| Mauritania | 3 | 0,006% |
| Mexico | 51 | 0,104% |
| Moldova | 25 | 0,051% |
| Myanmar | 2 | 0,004% |
| Nepal | 22 | 0,045% |
| Nicaragua | 11 | 0,022% |
| Nigeria | 6 | 0,012% |
| Not included or provided | 1 | 0,002% |
| Norway | 23 | 0,047% |
| New Zealand | 13 | 0,027% |
| Netherlands | 553 | 1,127% |
| Pakistan | 78 | 0,159% |
| Panama | 4 | 0,008% |
| Paraguay | 62 | 0,126% |
| Peru | 67 | 0,137% |
| Poland | 148 | 0,302% |
| Portugal | 66 | 0,135% |
| United Kingdom | 1432 | 2,92% |
| Dominican Rep. | 32 | 0,065% |
| Czech Republic | 44 | 0,09% |
| Romania | 984 | 2,006% |
| Russia | 968 | 1,974% |
| Senegal | 45 | 0,092% |
| Serbia | 17 | 0,035% |
| Sierra Leona | 1 | 0,002% |
| Singapore | 2 | 0,004% |
| Syria | 3 | 0,006% |
| South Africa | 8 | 0,016% |
| Sweden | 49 | 0,1% |
| Switzerland | 365 | 0,744% |
| Tajikistan | 1 | 0,002% |
| Thailand | 31 | 0,063% |
| Tunisia | 5 | 0,01% |
| Turkey | 5 | 0,01% |
| Ukraine | 1155 | 2,355% |
| Uruguay | 169 | 0,345% |
| Uzbekistan | 2 | 0,004% |
| Venezuela | 494 | 1,007% |